


Tokmanni Group’s Business Review for January–September 2025: A twofold quarter, record result in Tokmanni segment, Dollarstore segment’s result declined due to increased expenses
2026.01.06
THIRD QUARTER 2025 HIGHLIGHTS
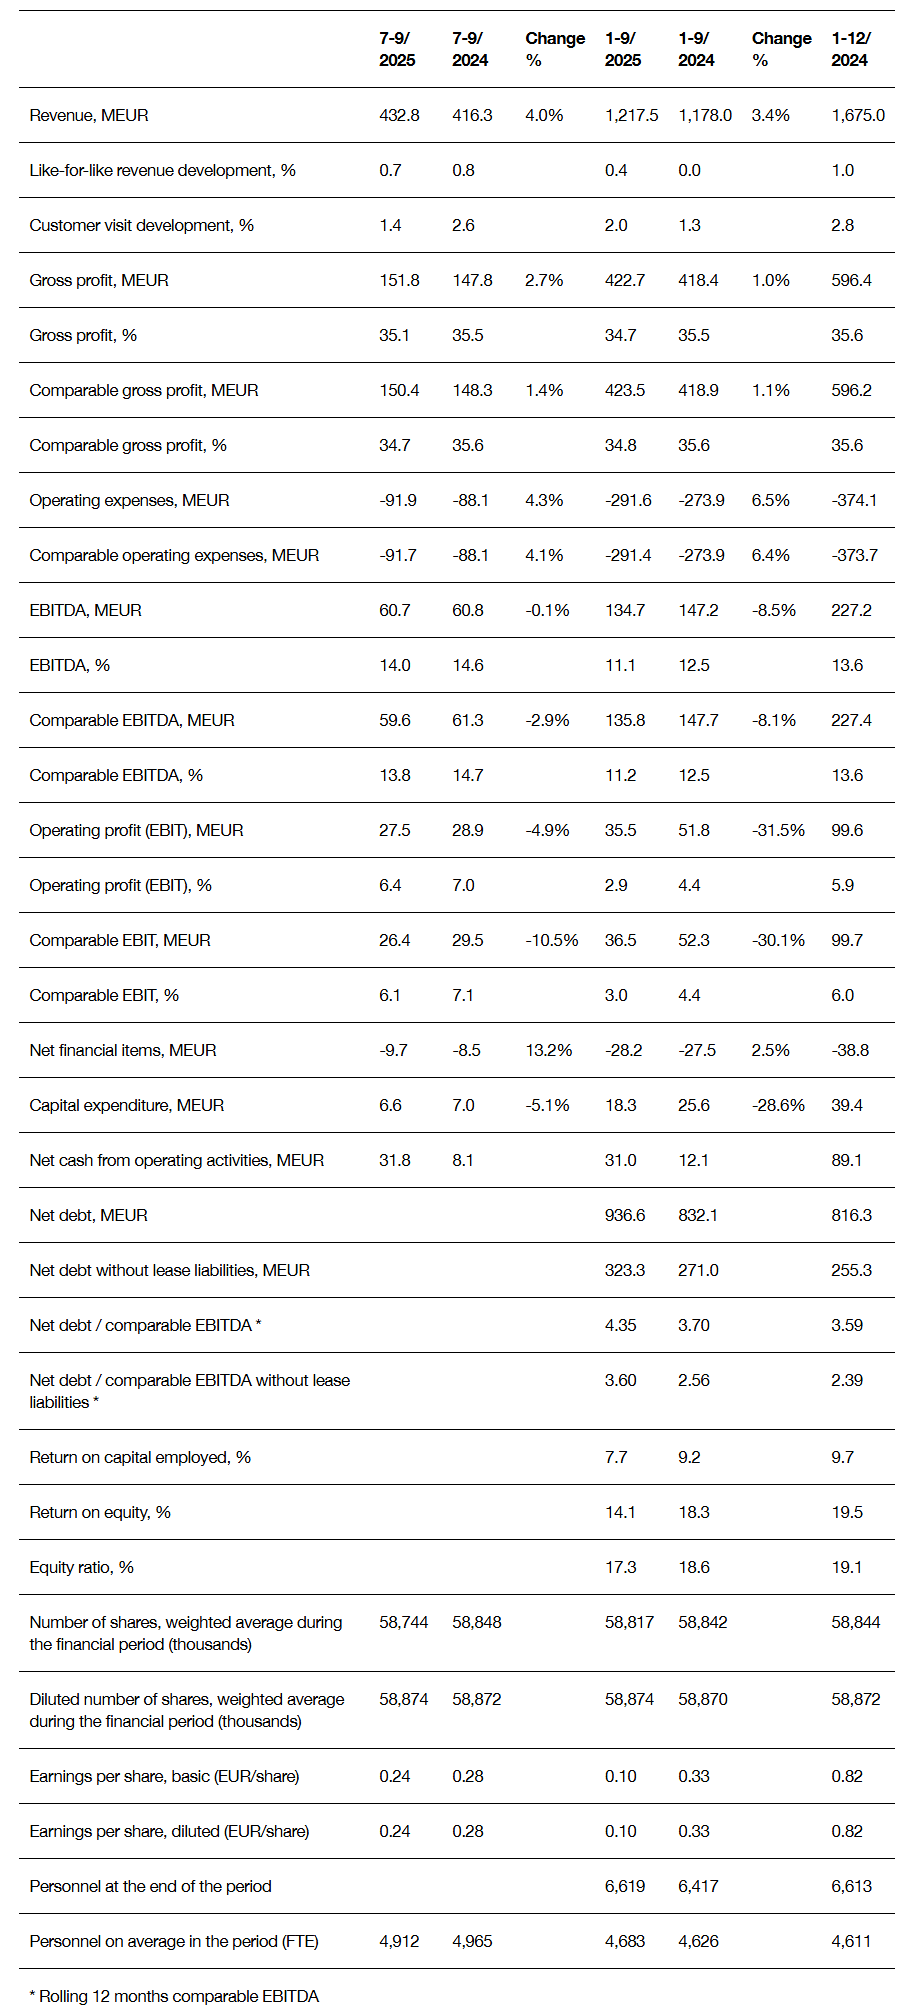
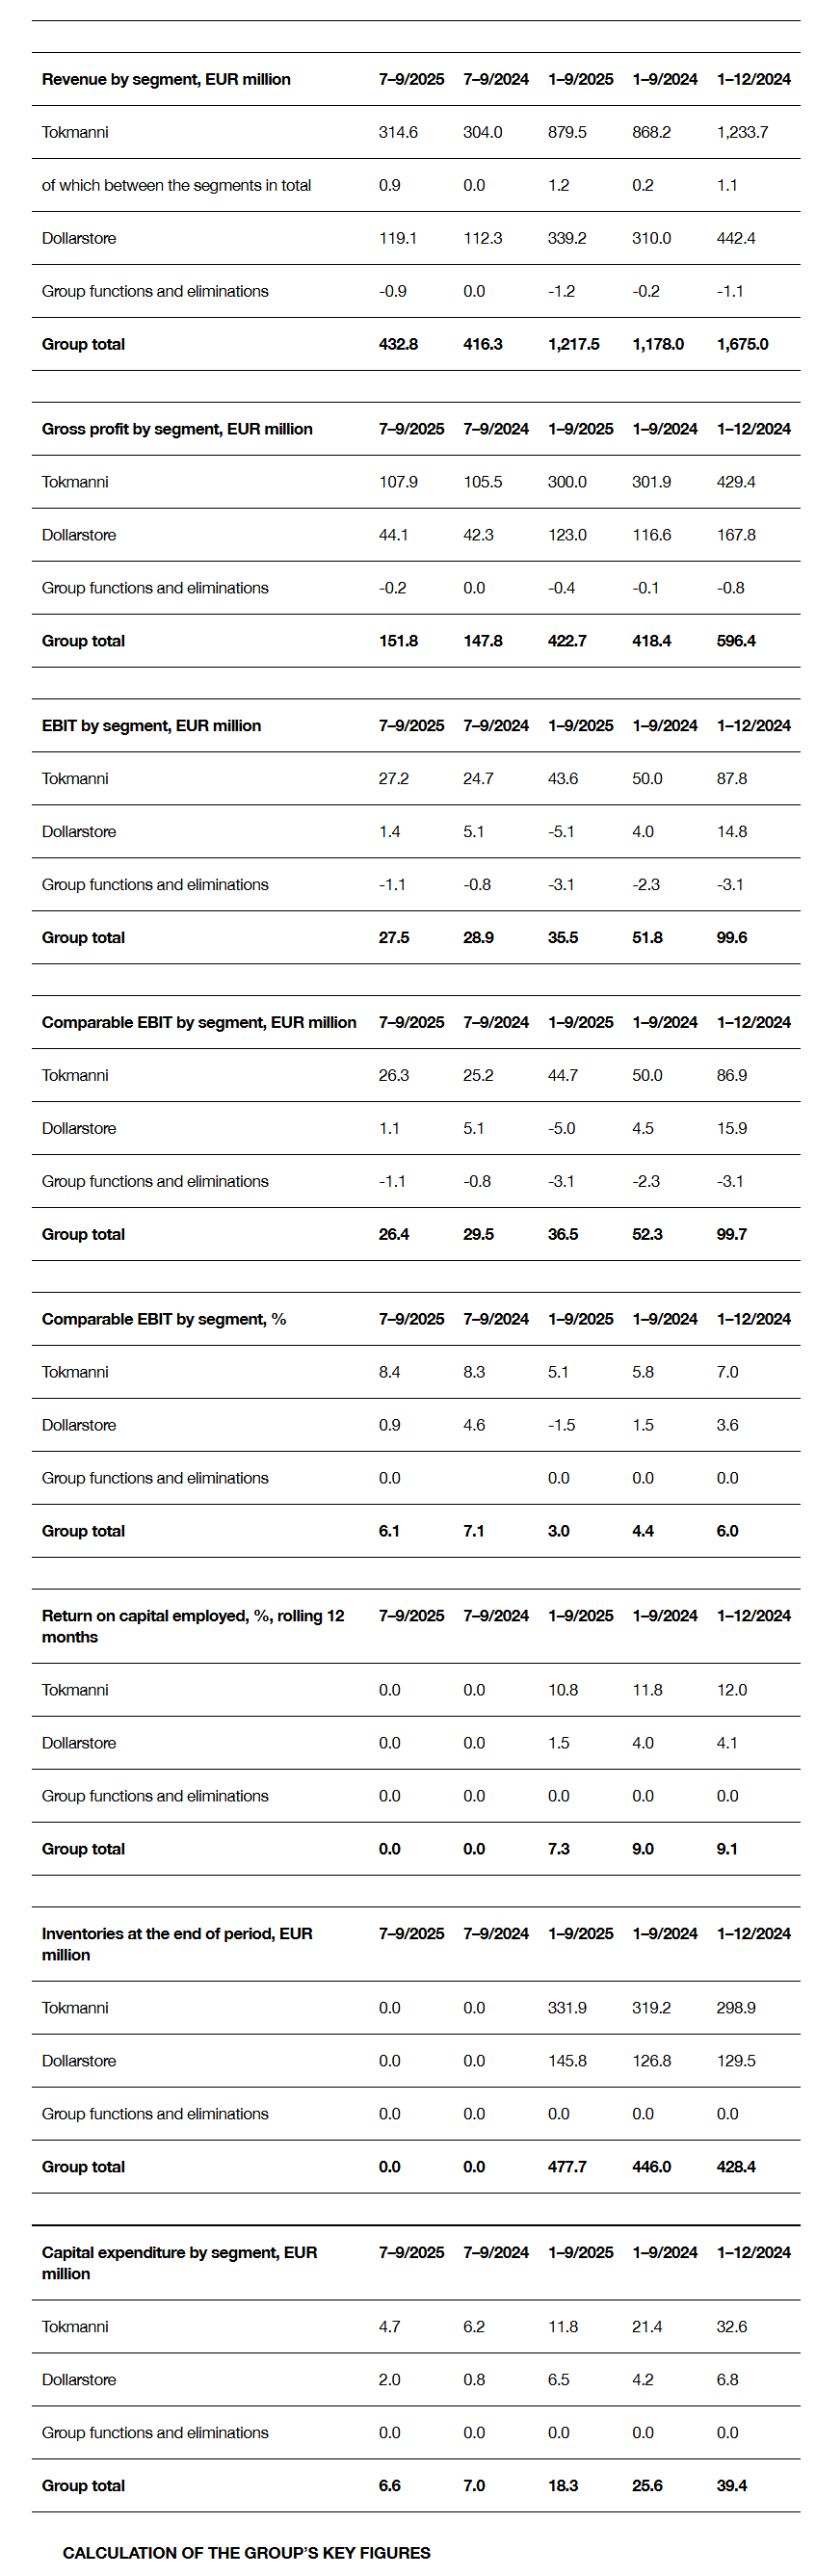
Tokmanni Group’s revenue grew by 4.0% (14.3%) and was EUR 432.8 million (416.3)
Like-for-like revenue grew by 0.7% (0.8%)
Comparable gross profit was EUR 150.4 million (148.3) and comparable gross profit % was 34.7% (35.6%)
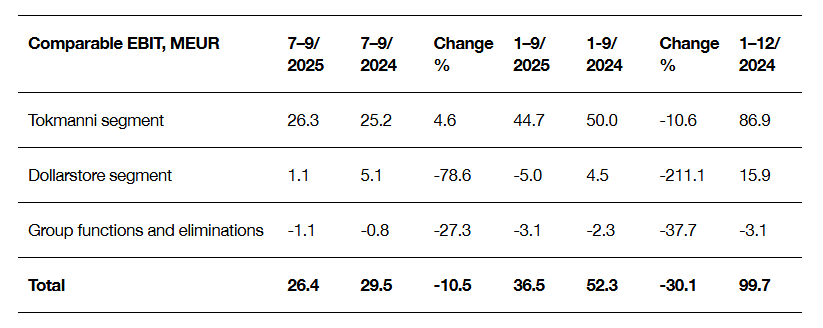
Comparable EBIT amounted to EUR 26.4 million (29.5), 6.1% of revenue (7.1%)
Cash flow from operating activities amounted to EUR 31.8 million (8.1)
Earnings per share, diluted was EUR 0.24 (0.28)
JANUARY–SEPTEMBER 2025 HIGHLIGHTS
Tokmanni Group’s revenue grew by 3.4% (27.8%) and was EUR 1,217.5 million (1,178.0)
Like-for-like revenue grew by 0.4% (0.0%)
Comparable gross profit was EUR 423.5 million (418.9) and comparable gross profit % was 34.8% (35.6%)
Comparable EBIT amounted to EUR 36.5 million (52.3), 3.0% of revenue (4.4%)
Cash flow from operating activities amounted to EUR 31.0 million (12.1)
Earnings per share, diluted was EUR 0.10 (0.33)
SPECIFIED GUIDANCE FOR 2025
In 2025, Tokmanni Group expects its revenue to be EUR 1,710–1,750 million. Comparable EBIT is expected to be EUR 85–95 million.
Previous guidance for 2025 (issued on 18 July 2025)
In 2025, Tokmanni Group expects its revenue to be EUR 1,700–1,790 million. Comparable EBIT is expected to be EUR 85–105 million.
PAYMENT OF THE SECOND DIVIDEND INSTALMENT
The Board of Directors of Tokmanni Group Corporation has decided not to exercise its authorisation to pay a second dividend instalment for the financial year ending 31 December 2024. The decision takes into account Tokmanni Group’s upcoming investments in store locations, strategic projects, and IT systems, as well as the current structure of the company’s balance sheet. Tokmanni Group Board’s aim is to strengthen the company’s balance sheet and to ensure the funding of investments and growth.
TOKMANNI GROUP CEO MIKA RAUTIAINEN
We have continued to take determined actions in line with our strategy to ensure growth and to integrate Dollarstore into Tokmanni Group. In the third quarter, the Group’s total revenue increased by 4.0%. This development was particularly driven by the increase in the number of stores in Denmark and Sweden.
In Tokmanni stores, summer seasonal products performed well in the third quarter, thanks especially to favourable weather in July and discount sales. The sales campaigns increased customer visits, but at the same time reduced the comparable gross margin percent. However, in Tokmanni segment we achieved a higher comparable EBIT than last year, which was partly driven by our determined efforts to lower operating expenses. Tokmanni segment’s comparable EBIT increased to EUR 26.3 million (25.2). Regarding Spar, we are proceeding according to plan and have now opened three EUROSPAR stores in conjunction with Tokmanni stores.
In Dollarstore stores the strategic changes to the product assortment increased sales of higher-priced products, thereby raising the average basket value. The main driver of increased operating expenses was the expenses related to the opening of new stores. Dollarstore segment’s comparable EBIT amounted to EUR 1.1 million (5.1). Actions to improve profitability continue as planned.
In the latter part of the third quarter, we opened a pilot store in Sweden to test an assortment of over 30,000 products, combining well-known items from both Tokmanni and Dollarstore. The target of this pilot is to create a more unified and attractive product range and concept across all our operating countries.
Tokmanni Group’s current strategy period will conclude at the end of this year. At the beginning of the new strategy period, the focus will remain on improving profitability, meaning that in both segments, we will concentrate not only on sales but also on margin and cost efficiency. At the same time, we will continue integrating Dollarstore into Tokmanni Group and developing our store network in Finland, Sweden, and Denmark.
KEY FIGURES
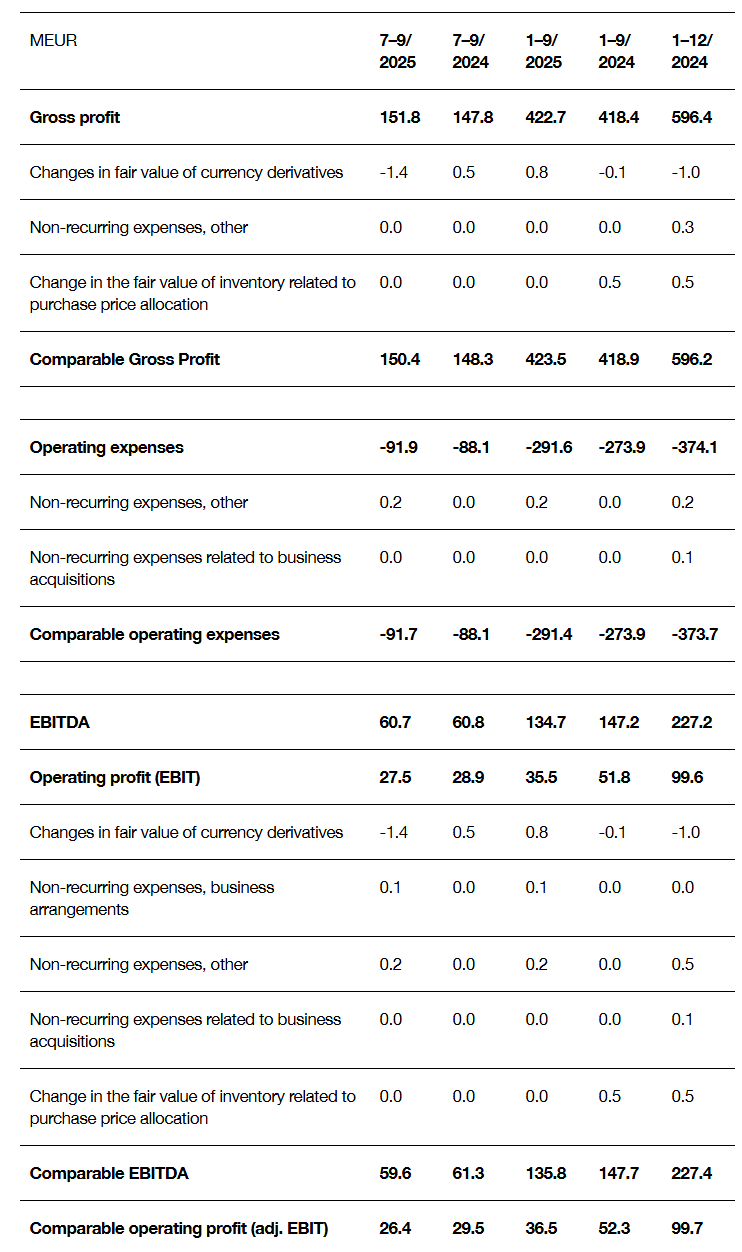
ADJUSTMENTS AFFECTING COMPARABILITY
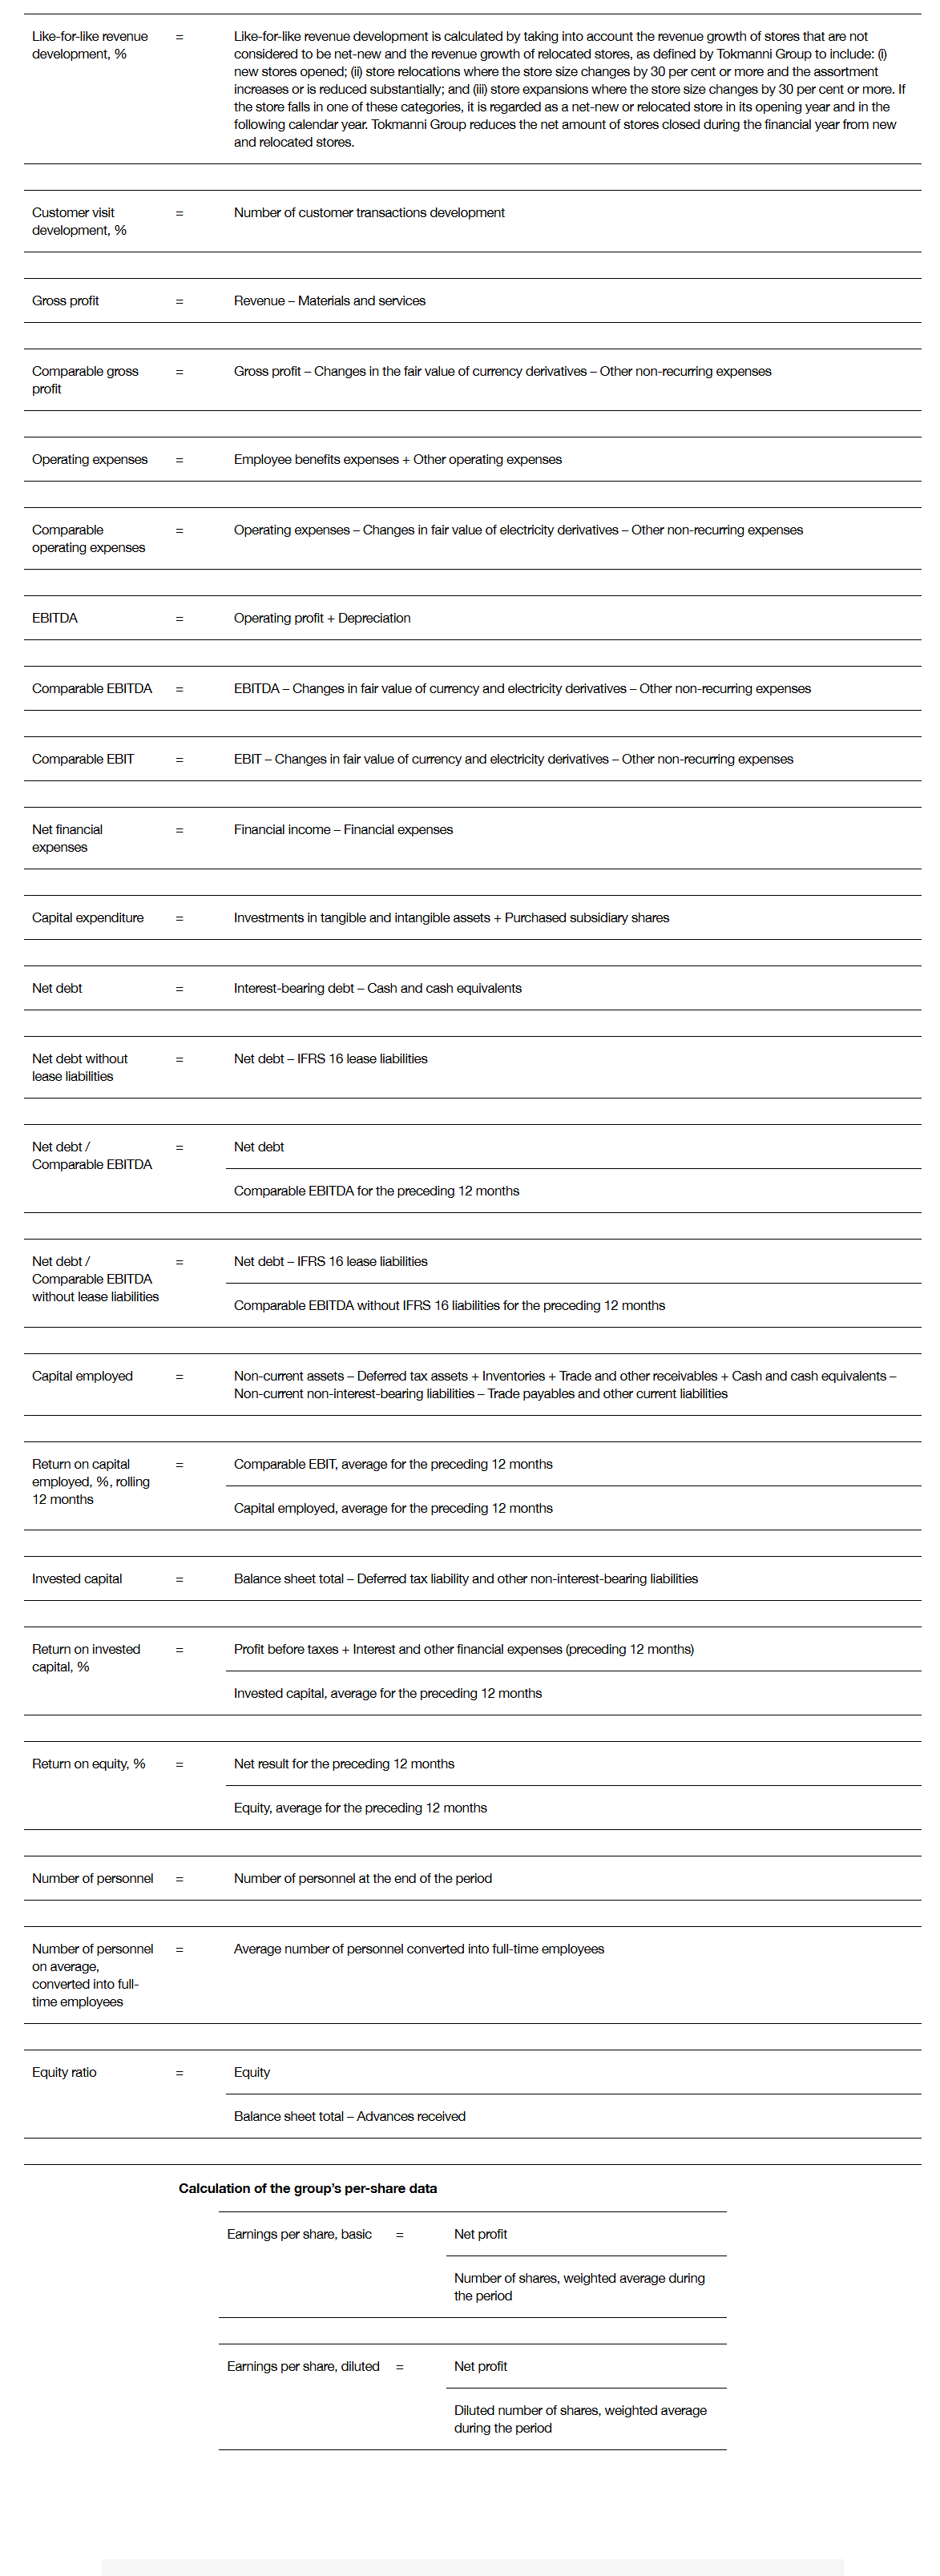
Tokmanni Group reports EBITDA and EBIT as its key performance indicators and makes adjustments to improve comparability and provide a better view of Tokmanni Group’s operational performance. EBITDA is not a key indicator according to IFRS accounting standards and it represents operating profit before depreciation and amortisation. Comparable EBITDA and EBIT represent the same indicators excluding items that Tokmanni Group’s management considers to be exceptional and non-recurring. The items include changes in the fair value of currency derivatives, which are adjusted by Tokmanni Group as they are unrealised gains or losses related to Tokmanni Group’s open cash flow hedge positions, and hence not related to Tokmanni Group’s operational performance during the review periods. In addition, other non-recurring costs related to acquired businesses and companies are included in the items affecting comparability as well as other non-recurring expenses such as costs related to damages.
Tokmanni Group’s management uses the comparable EBITDA margin and comparable EBIT margin as key performance indicators when evaluating Tokmanni Group’s and its segments’ underlying operational performance.
Adjustments affecting comparability
MARKET DEVELOPMENT
According to the statistics of the Finnish Grocery Trade Association FGTA (http://www.pty.fi), the total sales of department store and hypermarket chains in Finland increased by 4.4% in the third quarter of 2025. In particular, grocery sales increased. It is important to note that the statistics compiled by the FGTA only cover part of the market relevant for Tokmanni segment.
According to the statistics of the Swedish Food Retailers’ Federation (https://www.svenskdagligvaruhandel.se/), the Food Retail Index in Sweden increased by 5.4% in total in the third quarter of 2025. Sales in brick-and-mortar stores increased by 5.2% and online sales by 8.4%. The Food Retail Index measures sales growth in the grocery trade and does not include specialised food stores or service trade. It is important to note that the statistics compiled by the Swedish Food Retailers Federation only cover part of the market relevant for Dollarstore store chain.
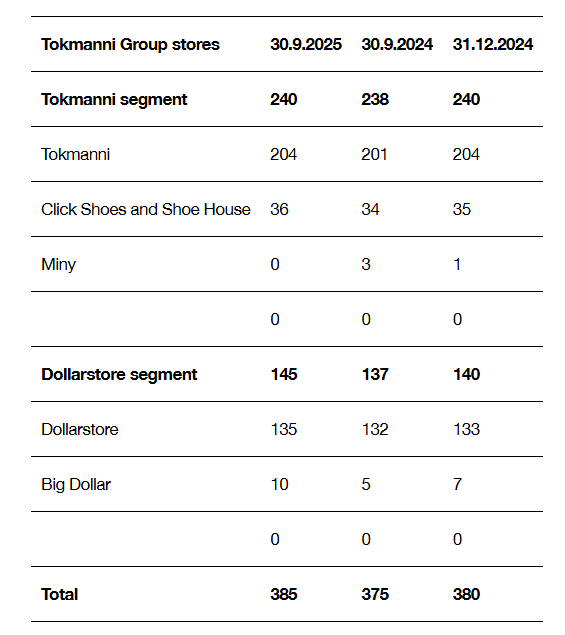
TOKMANNI GROUP’S STORE NETWORK
At the end of September 2025, Tokmanni Group had a total of 385 stores (31 December 2024: 380). In Finland, Tokmanni Group had 204 Tokmanni stores and a total 36 of Click Shoes and Shoe House stores. In Sweden, Tokmanni Group had 135 Dollarstore stores, and in Denmark, 10 Big Dollar stores. EUROSPAR supermarket is located at Tokmanni store in Ylöjärvi. After the review period, EUROSPAR supermarkets have been opened in Masku and Tornio.
FINANCIAL DEVELOPMENT
Reporting structure
Tokmanni Group consists of Tokmanni and Dollarstore segments as well as Group functions and eliminations. Tokmanni segment consists of Tokmanni stores, Click Shoes stores and Shoe House stores, as well as Tokmanni and Click Shoes online stores. Dollarstore segment consists of Dollarstore and Big Dollar stores.
Seasonality
Tokmanni Group’s business is subject to seasonality, which has a significant effect on its revenue, profitability, and cash flow. In general, Tokmanni Group’s revenue, profitability and cash flow are lowest in the first quarter and highest in the fourth quarter due to Christmas sales.
TOKMANNI GROUP
Revenue
July–September 2025
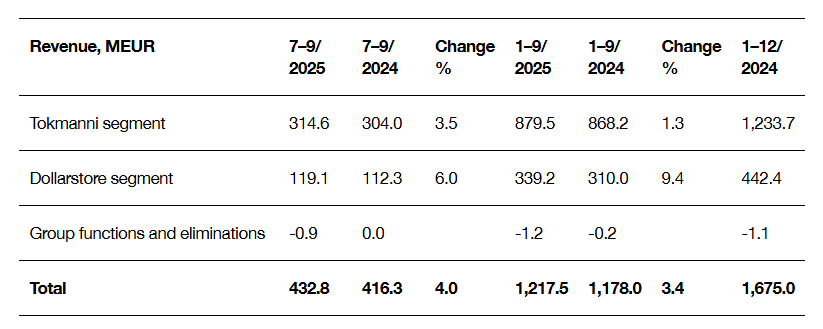
In the third quarter 2025, Tokmanni Group’s revenue grew by 4.0% (14.3%) to EUR 432.8 million (416.3). Sales of Tokmanni Group’s grocery products grew by 2.3% compared to the corresponding period of the previous year. The proportion of grocery sales was 52.6% (53.1%) of total sales. Sales of non-grocery products grew by 4.3%.
Tokmanni Group’s like-for-like revenue increased by 0.7% (0.8%). Tokmanni Group’s like-for-like customer visits in stores decreased by 0.7% (+1.4%), and the total number of customers grew by 1.4% (2.6%) compared to the corresponding period of the previous year. The like-for-like average basket size increased by 1.4% to EUR 19.89 (19.62).
The brands managed by Tokmanni Group (private label products, exclusive brands and non-branded products) represented 27.6% (25.1%) of third quarter sales.
January–September 2025
In January–September 2025, Tokmanni Group’s revenue grew by 3.4% (27.8%) to EUR 1,217.5 million (1,178.0). Sales of Tokmanni Group’s grocery products grew by 3.1% compared to the corresponding period of the previous year. The proportion of grocery sales was 54.8% (54.5%) of total sales.
Tokmanni Group’s like-for-like revenue increased by 0.4% (0.0%). Tokmanni Group’s like-for-like customer visits in stores increased by 0.2% (-0.2%), and the total number of customers grew by 2.0% (1.3%) compared to the corresponding period of the previous year. The like-for-like average basket size increased by 0.2% to EUR 19.60 (19.56).
The brands managed by Tokmanni Group (private label products, exclusive brands and non-branded products) represented 26.2% (24.7%) of January-September sales.
Profitability
July–September 2025
In the third quarter, Tokmanni Group’s gross profit amounted to EUR 151.8 million (147.8), and the gross margin was 35.1% (35.5%). Comparable gross profit was EUR 150.4 million (148.3), corresponding to a comparable gross margin of 34.7% (35.6).
Tokmanni Group’s operating expenses remained well controlled and were EUR 91.9 million (88.1), or 21.2% of revenue (21.2%). Personnel expenses represented EUR 56.1 million (53.4), or 13.0% of revenue (12.8%). Comparable operating expenses were EUR 91.7 million (88.1), or 21.2% of revenue (21.2%).
The Group’s EBITDA totalled EUR 60.7 million (60.8), corresponding to an EBITDA margin of 14.0% (14.6%). Comparable EBITDA totalled EUR 59.6 million (61.3), and the comparable EBITDA margin was 13.8% (14.7%).
Tokmanni Group’s depreciation amounted to EUR 33.2 million (31.9). Depreciation excluding depreciation of tangible and intangible assets (PPA) arising from the acquisitions amounted to EUR 32.4 million (31.1). EUR 0.8 million (0.7) was recognised for depreciation of tangible and intangible assets (PPA) arising in the acquisitions.
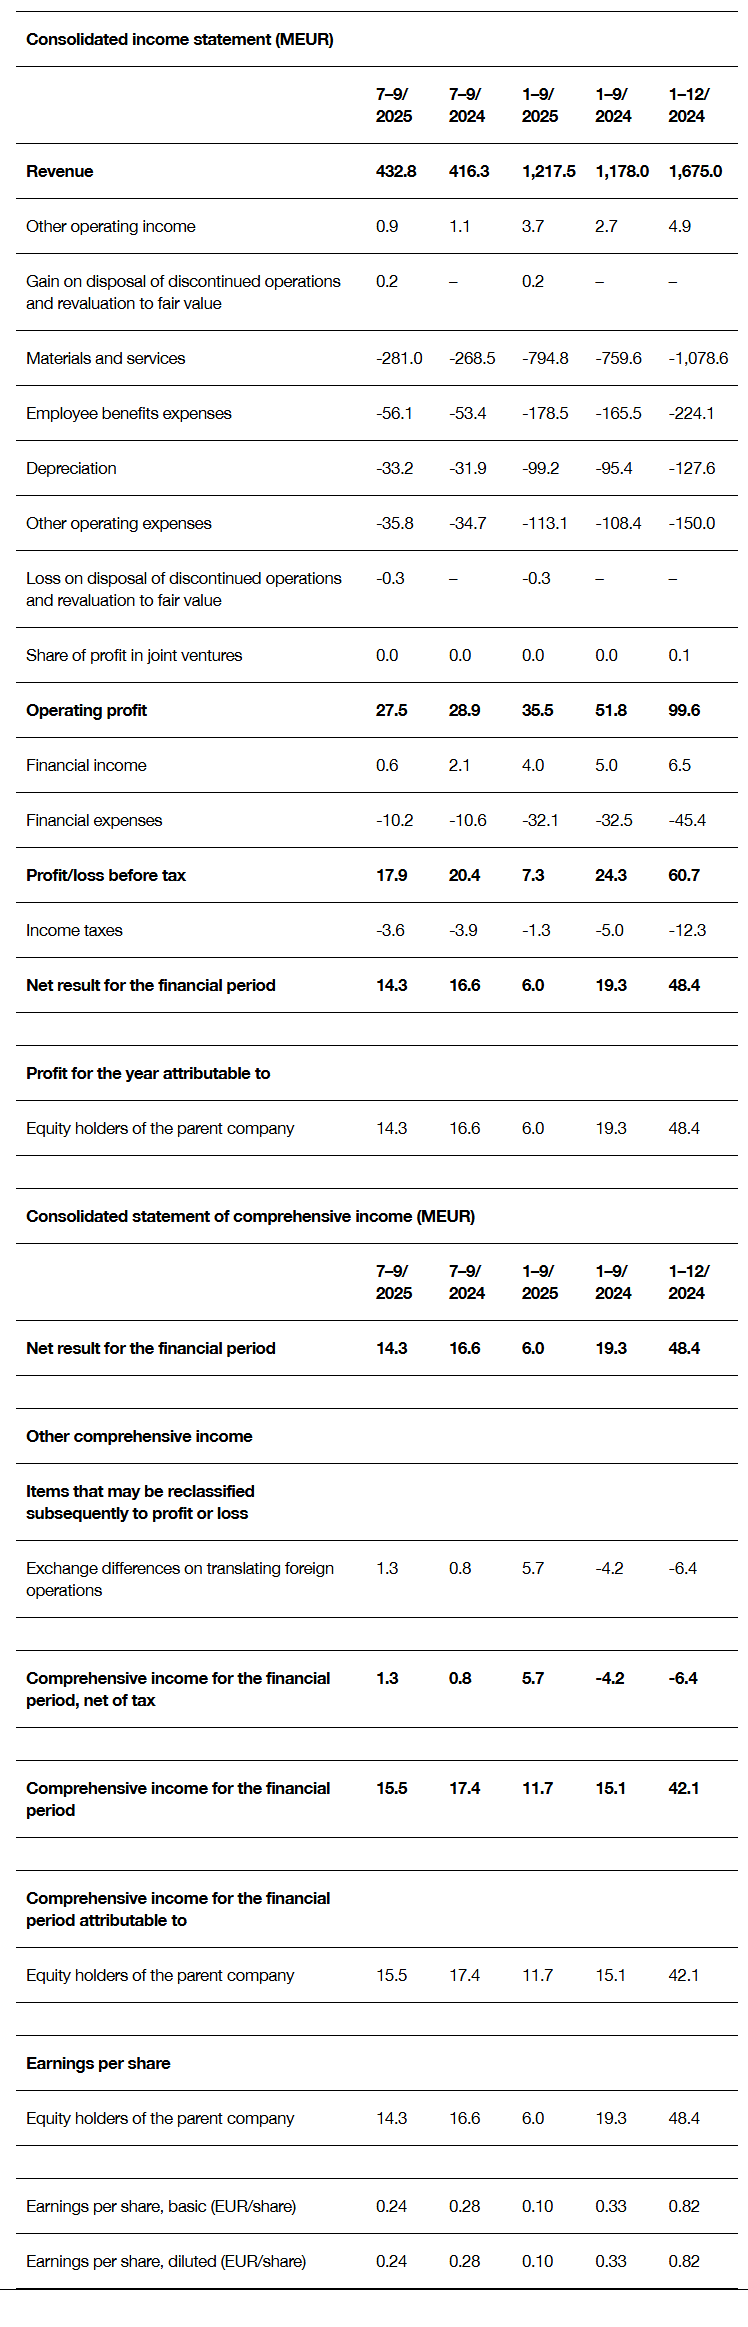
The Group’s EBIT in the third quarter totalled EUR 27.5 million (28.9), corresponding to an EBIT margin of 6.4% (7.0%). Comparable EBIT was EUR 26.4 million (29.5), and the comparable EBIT margin was 6.1% (7.1%). The decline in EBIT was due to the performance of Dollarstore segment during the review period.
Tokmanni Group’s net financial items totalled EUR -9.7 million (-8.5). The result before taxes was EUR 17.9 million (20.4). Taxes for the period amounted to EUR -3.6 million (-3.9). The net result was EUR 14.3 million (16.6).
Diluted earnings per share were EUR 0.24 (0.28).
January–September 2025
In January–September 2025, Tokmanni Group’s gross profit amounted to EUR 422.7 million (418.4), and the gross margin was 34.7% (35.5%). Comparable gross profit was EUR 423.5 million (418.9), corresponding to a comparable gross margin of 34,8% (35,6).
Tokmanni Group’s operating expenses were EUR 291.6 million (273.9), or 23.9% of revenue (23.2%). Personnel expenses represented EUR 178.5 million (165.5), or 14.7% of revenue (14.0%). Comparable operating expenses were EUR 291.4 million (273.9), or 23.9% of revenue (23.2%).
The Group’s EBITDA totalled EUR 134.7 million (147.2), corresponding to an EBITDA margin of 11.1% (12.5%). Comparable EBITDA totalled EUR 135.8 million (147.7), and the comparable EBITDA margin was 11.2% (12.5%).
Tokmanni Group’s depreciation amounted to EUR 99.2 million (95.4). Depreciation excluding depreciation of tangible and intangible assets (PPA) arising from the acquisitions amounted to EUR 97.0 million (93.2). EUR 2.3 million (2.2) was recognised for depreciation of tangible and intangible assets (PPA) arising in the acquisitions.
The Group’s EBIT totalled EUR 35.5 million (51.8), corresponding to an EBIT margin of 2.9% (4.4%). Comparable EBIT was EUR 36.5 million (52.3), and the comparable EBIT margin was 3.0% (4.4).
Tokmanni Group’s net financial items totalled EUR -28.2 million (-27.5). The result before taxes was EUR
7.3 million (24.3). Taxes for the review period were EUR -1.3 million (-5.0). The net result was EUR 6.0 million (19.3). The weaker result compared to the corresponding period of the previous year was mainly due to decreased gross margin, increased operating expenses and higher depreciation.
Diluted earnings per share were EUR 0.10 (0.33).
By the end of September 2025, the achieved synergy benefits of Tokmanni’s and Dollarstore’s integration amounted to EUR 21.7 million on an annual basis, and we have now exceeded our target of annual synergy benefits of over EUR 20 million by the end of 2025.
Balance sheet, financing and cash flow
At the end of September 2025, Tokmanni Group’s inventories amounted to EUR 477.7 million (446.0). At the end of September, Tokmanni segment’s inventories amounted to EUR 331.9 million (319.2) and Dollarstore segment’s inventories amounted to EUR 145.8 million (126.8).
Group’s consolidated cash flow from operating activities amounted to EUR 31.8 million (8.1) in the third quarter of 2025. In January–September, the consolidated cash flow from operating activities amounted to EUR 31.0 million (12.1). The development of cash flow from operating activities was particularly affected by a change in Dollarstore’s product deliveries: products are now delivered to a significant extent via the Group’s warehouse in Örebro, in Sweden, whereas previously wholesalers mainly delivered products directly to the stores. This is based on Tokmanni Group’s decision to increase direct imports and reduce deliveries from wholesalers in order to streamline buying and sourcing.
At the end of September 2025, Tokmanni Group had a total of EUR 173.0 million (166.3) available in credit facilities, consisting of loan agreements with credit institutions and a commercial paper programme. Cash and cash equivalents amounted to EUR 8.9 million (13.0) at the end of September 2025.
At the end of September 2025, Tokmanni Group’s interest-bearing debt totalled EUR 945.5 million (845.1), including EUR 220.0 million (205.0) in non-current loans from credit institutions, excluding accrued issue expenses, and EUR 113.0 million (79.7) in current loans from credit institutions and commercial paper programme. The remainder of the liabilities mainly consist of lease agreement liabilities reported under IFRS 16. The Group’s net debt excluding lease liabilities amounted to EUR 323.3 million (271.0) and the increase was mainly due to growth in inventories and investments in store locations.
Tokmanni Group’s ratio of net debt to comparable EBITDA excluding the impact of IFRS 16 was 3.60 at the end of September 2025 (2.56). Tokmanni Group’s target is an efficient capital structure. The long-term goal is to keep the ratio of net debt to comparable EBITDA, excluding the impact of IFRS 16, below 2.25 at year-end.
Tokmanni Group’s equity ratio was 17.3% (18.6%) at the end of September 2025.
Capital expenditure
Tokmanni Group’s capital expenditure in the third quarter of 2025 totalled EUR 6.6 million (7.0). Capital expenditure was related to the expansion, development and maintenance of the store network, as well as the development of digital services. In January–September 2025, the capital expenditure totalled EUR 18.3 million (25.6).
TOKMANNI SEGMENT
Tokmanni segment includes Tokmanni, Click Shoes and Shoe House stores, as well as Tokmanni and Click Shoes online stores.
Revenue
July–September 2025
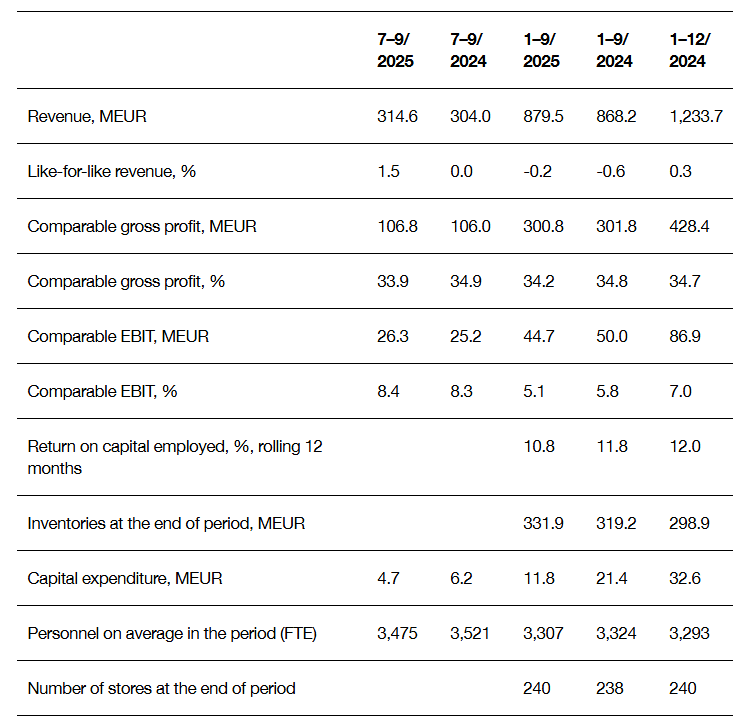
In the third quarter, Tokmanni segment’s revenue increased by 3,5% (1,3%) to EUR 314,6 million (304,0). Seasonal summer products found buyers in the third quarter, especially thanks to attractive offers and the favourable weather in July. Sales of grocery products increased by 2.5%. The proportion of grocery sales was 51.0% (51.4%) of Tokmanni segment’s total sales. Sales of non-grocery products increased by 4.3%.
Tokmanni segment’s like-for-like revenue increased by 1.5% (0.0%). Like-for-like customer visits in stores increased by 1.3% (1.8%), and the total number of customers increased by 2.6% (2.4%). The like-for-like average basket size increased by 0.2% to EUR 21.14 (21.09).
Direct imports accounted for 27.5% of Tokmanni segment’s sales (26.5%). These can be broken down into products purchased using the sourcing company in Shanghai, China, which accounted for 21.8% (21.4%), and other direct imports, which accounted for 5.7% (5.1%).
January–September 2025
In January–September 2025, Tokmanni segment’s revenue increased by 1.3% (1.3%) to EUR 879.5 million (868.2). Sales of grocery products increased by 2.2%. The proportion of grocery sales was 53.8% (53.3%) of Tokmanni segment’s total sales.
Tokmanni segment’s like-for-like revenue decreased by 0.2% (-0.6%). Like-for-like customer visits in stores increased by 0.7% (0.4%), and the total number of customers increased by 1.6% (1.6%). The like-for-like average basket size decreased by 0.9% to EUR 20.81 (21.01).
Direct imports accounted for 25.6% of Tokmanni segment’s sales (25.4%). These can be broken down into products purchased using the sourcing company in Shanghai, China, which accounted for 19.6% (20.0%), and other direct imports, which accounted for 6.0% (5.4%).
Profitability
July–September 2025
In the third quarter 2025, Tokmanni segment’s gross profit amounted to EUR 107.9 million (105.5), and the gross margin was 34.3% (34.7%). Comparable gross profit was EUR 106.8 million (106.0), corresponding to a comparable gross margin of 33.9% (34.9%). The comparable gross margin decreased mainly due to discount sales of summer and spring season products.
Tokmanni segment's operating expenses decreased thanks to successful, broad-based cost control. Particular focus was placed on enhancing marketing efficiency and managing personnel expenses. The operating expenses totalled EUR 61.2 million (61.7), or 19.5% of revenue (20.3%). Personnel expenses were EUR 35.9 million (35.4) of total operating expenses, or 11.4% of revenue (11.6%). Comparable operating expenses were EUR 61.1 million (61.7), or 19.4% of revenue (20.3%).
Tokmanni segment’s EBITDA totalled EUR 47.5 million (44.9), which corresponds to an EBITDA margin of 15.1% (14.8%). Comparable EBITDA totalled EUR 46.7 million (45.4), and the comparable EBITDA margin was 14.8% (14.9%).
Tokmanni segment’s EBIT totalled EUR 27.2 million (24.7), corresponding to an EBIT margin of 8.6% (8.1%). Comparable EBIT was EUR 26.3 million (25.2), and the comparable EBIT margin was 8.4% (8.3%).
Tokmanni segment’s capital expenditure totalled EUR 4.7 million (6.2).
January–September 2025
In January–September 2025, Tokmanni segment’s gross profit amounted to EUR 300.0 million (301.9), and the gross margin was 34.1% (34.8%). Comparable gross profit was EUR 300.8 million (301.8), corresponding to a comparable gross margin of 34.2% (34.8%).
Tokmanni segment’s operating expenses totalled EUR 198.5 million (193.6), or 22.6% of revenue (22.3%). Personnel expenses were EUR 116.1 million (111.3) of total operating expenses, or 13.2% of revenue (12.8%). Comparable operating expenses were EUR 198.4 million (193.6), or 22.6% of revenue (22.3%).
Tokmanni segment’s EBITDA totalled EUR 104.7 million (110.9), which corresponds to an EBITDA margin of 11.9% (12.8%). Comparable EBITDA totalled EUR 105.8 million (110.9), and the comparable EBITDA margin was 12.0% (12.8%).
Tokmanni segment’s EBIT totalled EUR 43.6 million (50.0), corresponding to an EBIT margin of 5.0% (5.8%). Comparable EBIT was EUR 44.7 million (50.0), and the comparable EBIT margin was 5.1% (5.8%).
Tokmanni segment’s capital expenditure totalled EUR 11.8 million (21.4).
DOLLARSTORE SEGMENT
Dollarstore segment consists of Dollarstore and Big Dollar stores.
Revenue
July–September 2025
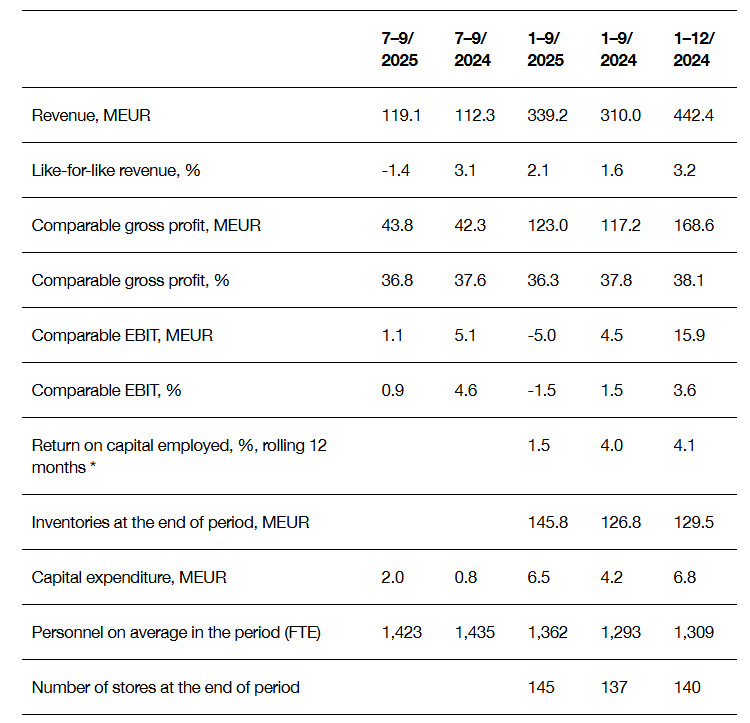
In the third quarter, Dollarstore segment’s revenue increased by 6.0% to was EUR 119.1 million (112.3). In local currencies, revenue grew by 3.0% (6.3%) compared to the corresponding period of the previous year. Sales of grocery products grew by 2.1% compared to the corresponding period of the previous year in local currencies. The proportion of grocery sales was 56.8% (57.4%) of Dollarstore segment’s total sales. The 4.3% growth in sales of non-grocery products was driven by a broader selection of Tokmanni Group's own brands.
Dollarstore segment’s like-for-like revenue decreased by 1.4% (+3.1%) in local currencies. Like-for-like customer visits in stores decreased by 4.9% (+0.5%), and the total number of customers decreased by 1.0% (+3.2%) year-on-year. The like-for-like average basket size increased by 3.6% to EUR 17.06 (16.46). More moderate summer clearance sales compared to previous year led to a decrease in customer visits.
January–September 2025
In January–September 2025, Dollarstore segment’s revenue increased by 9.4% and was EUR 339.2 million (310.0). In local currencies, revenue grew by 6.3% (4.2%) compared to the corresponding period of the previous year. Sales of grocery products grew by 5.5% compared to the corresponding period of the previous year in local currencies. The proportion of grocery sales was 57.1% (57.6%) of Dollarstore segment’s total sales.
Dollarstore segment’s like-for-like revenue increased by 2.1% (1.6%) in local currencies. Like-for-like customer visits in stores decreased by 0.9% (-1.5%), and the total number of customers grew by 2.8%
(0.7%) year-on-year. The like-for-like average basket size increased by 3.0% to EUR 16.88 (16.39).
Use of estimates
This report is unaudited.
INFORMATION BY SEGMENT
About JINHAN FAIR
JINHAN FAIR for Home & Gifts(Poly Spring/Autumn Fair Phase Ⅱ) is a leading international trade platform organized by Poly Exhibition. Established in 2000, JINHAN FAIR has been successfully held for 53 editions and is recognized as one of China's most established sourcing fairs for the home and gifts industry. JINHAN FAIR is also the only Union of international Fairs-approved export trade fair in the home & gifts sector in China.

The 54th Jinhan Fair
Jinhan Fair Online Exhibition


 Visitor Registration
 Booth Application